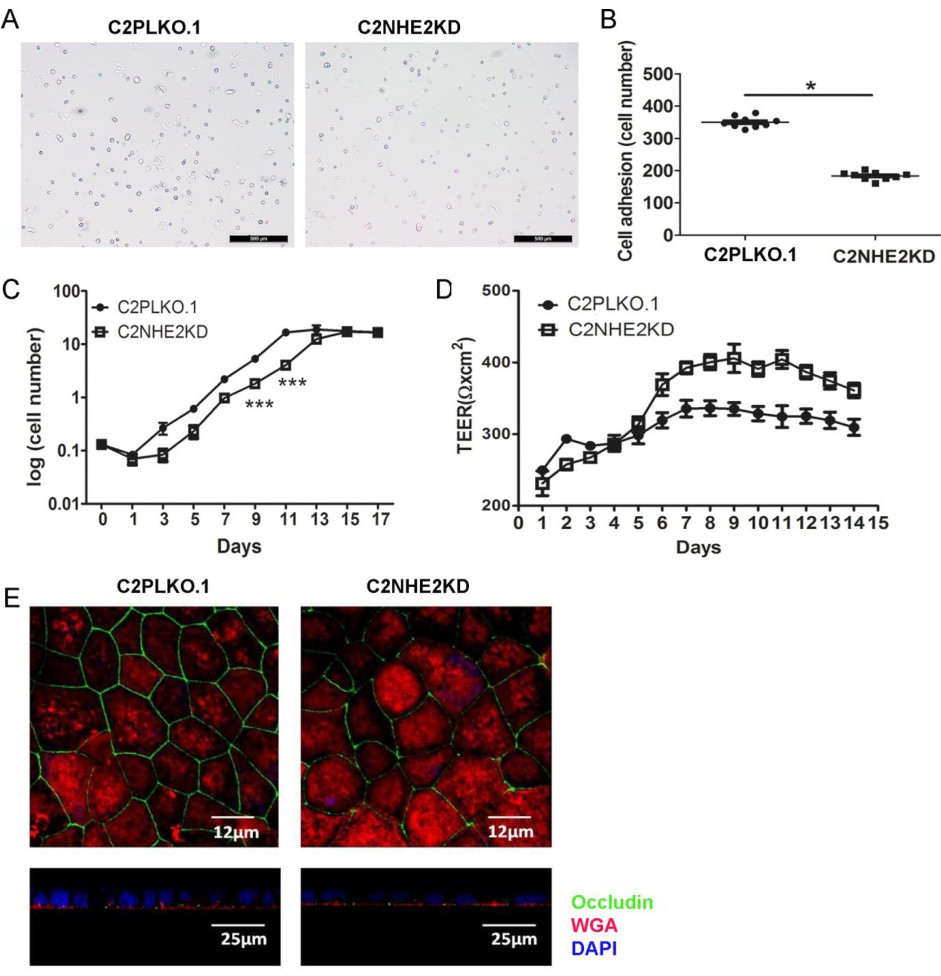
Fig. 2. Cell characteristics of C2PLKO.1 and C2N2KD cells. (A,B) Cell adhesion of C2PLKO.1 and C2N2KD cells analyzed by counting the adherent cells, 24 h after the cells were seeded with same density. Images of C2PLKO.1 and C2NHE2KD cells were acquired under the phase contrast microscopy. (n=5, mean ± SEM, unpaired student t-test, *p<0.05). (C) The growth curves of C2PLKO.1 cells and C2NHE2KD cells seeded at same density and counted every 48 h. (n=5, mean ± SEM, unpaired student t-test, ***p<0.001) (D) TEER curves of C2PLKO.1 cells and C2NHE2KD cells grown on transwell membranes from day 0 to day 14. (E) Immunofluorescence images of C2PLKO.1 and C2NHE2KD cells on transwell membrane on day 14 in xyz mode (63 ×objective, zoom = 4, scale bar = 12 μm) and in xzy mode (40 × objective, zoom = 3, scale bar = 25 μm). Green occludin, red WGA, blue nucleus. The differences in occludin and WGA immunofluenscence may be due to the difference in height, because the same distance from the support was chosen for the confocal plane. (n = 5, from 3 different cell passages).